Nitrogen Fertilization – Best Practices and Advancements [Professional]
Introduction
Nitrogen (N) is one of the most important mineral nutrients for plant growth, yield and crop quality. Precise timing and rate of N fertilizer application play a major role in plant nutrition. Prediction of N requirements is necessary for efficient utilization of nitrogen fertilizers. Improving the efficiency of N fertilizer utilization reduces the amount of N that can potentially contaminate soil and water resources. A fertilizer should be applied only after determining that it will be beneficial. Traditionally, plant nutrient status has been measured using a combination of soil and leaf analyses. In agricultural practice, due to the high mobility of nitrates in the soil, nitrogen fertilization is based on leaf appearance or leaf tissue analysis (Kłossowski, 1972; Munson, 1998).[1] Based on the Best Management Practices (BMPs) for nitrogen fertilization, site-specific management must consider the most appropriate placement as well as the appropriate application rate according to local agronomic recommendations.[2] Nitrogen fertilizers are most effectively used as part of a balanced fertilization plan that aims to maximize economic return and maintain environmental quality. Nitrogen contributes firstly to grain yield and forage biomass production, and at the same time to protein. Once the yield requirements for nitrogen have been met, further nitrogen uptake, especially later in the season, contributes mostly to protein level increases. For an optimum economic response when applying nitrogen fertilizer, the nitrogen application rate needs to be balanced with moisture and the availability of other plant nutrients. Soil testing is critical to determining the appropriate rate of nitrogen fertilizer to apply to match crop yield potential. This helps determine the availability of nitrogen along with other nutrients and the assessment of stored soil moisture. [1]
Related Scientific Articles
1.A liquid injection dosing system for site-specific fertilizer management[2]
Nitrogen fertilization on the soil surface is a common practice associated with high N loss to the environment and a low fertiliser recovery efficiency compared to the deep placement of fertilizer. The aim is to implement site-specific fertiliser management that encompasses a mechanised soil punching process combined with liquid fertiliser injection, which causes minimal disturbance of the soil subsurface (i.e., roots, soil or straw) and harmonises with conservative tillage practice. The objective was to design a hydraulic injection system to enable site-specific management according to the BMPs, as applied to mechanised soil punching to implement soil injection fertiliser placement. In this context, an injection dosing system (conceptual design, laboratory evaluations and analyses) has been developed to perform liquid injection synchronised with soil punching and variable rate application. In general, the applications were satisfactory because:
(i) the liquid injection was synchronised with soil punching and the fluid was incorporated into the soil at a depth greater than 50 mm, which was an appropriate deep placement with the potential to reduce nutrient losses combined by increasing nutrient uptake.
(ii) the application rate was varied in a representative range (5.0 up to 18 ml cycle−1), which demonstrated a good potential for soil injection of fertiliser as a function of the local agronomic recommendations. Both conditions were aligned with the BMPs.


2.Sensor-based nitrogen fertilization for mid-season rice production in southeast Missouri[3]
Sensor-based nitrogen (N) decision management tools have shown potential to improve N fertilizer efficiency, yield, and profitability. Small-plot experiments were conducted to evaluate the use of sensor- based management in guiding midseason N application decisions. Treatments were two rice (Oryza sativa L.) cultivars (Jupiter, a medium grain, and Roy J, a long grain) and eight N treatments:
- check (no N fertilizer);
- 60 lb N/acre applied preflood + midseason N applied based on sensor reading (sensor-based management);
- 90 lb N/acre applied preflood + midseason N applied based on sensor reading (sensor-based management);
- 120 lb N/acre applied preflood;
- 120 lb N/acre applied preflood + 30 lb N/acre applied at midseason (traditional practice);
- 120 lb N/acre applied preflood + midseason N applied based on sensor reading (sensor-based management);
- 150 lb N/acre applied preflood; and
- 180 lb N/acre applied preflood (N reference strip).
Grain yield and nitrogen use efficiency (NUE) were compared among N treatments. Results showed sensor-based management for midseason application recommended lower total N application rate by 15 to 90 lb N/acre over the traditional practice. These results indicate that N fertilization made by a sensor-based midseason recommendation can optimize yield and NUE in southeast Missouri.
3.Possibilities of using image analysis to estimate the nitrogen nutrition status of apple trees[4]
There are two classes of techniques for foliar analysis of nitrogen content: destructive and nondestructive. Laboratory procedures are accurate but destructive and cost and time consuming (Benitez Ramirez, 2010). Non-destructive methods are based on analyses of leaf blade colour and absorbed or reflected light. Leaf colour is a good indicator of plant health and nutrition status. The green colour of plant canopies is associated with leaf chlorophyll content, which is positively correlated with leaf N concentration (Wolfe et al., 1988). Vigorous vegetative growth and dark green leaves are characteristics of plants with an adequate N supply, as up to 75% of nitrogen in mesophyll cells can be located in the chloroplasts (Peoples, Dalling, 1988). The amount of solar radiation absorbed by a leaf is a function of the photosynthetic pigment content. Thus, leaf chlorophyll content is a key indicator of plant physiological status, linked directly to photosynthetic potential and primary production (Filella et al., 1995).
One of the results of nitrogen deficiency is lack of chlorophyll formation and a low chlorophyll density in plant leaves. Nitrogen deficiency markedly reduces chlorophyll and carotenoid concentrations within the leaves and changes their colour (Boussadia et al., 2010; Khavari-Nejad etal., 2013). Leaf chlorophyll content, which is correlated with leaf nitrogen concentration, may serve as a method of predicting plant N requirements (Baret, Fourty, 1997; Ali et al., 2012 b). A number of non-destructive, indirect methods for determining foliar nitrogen content are available, which vary in complexity and optimality. These include the use of a leaf colour chart (LCC) (Furuya, 1987) and portable leaf greenness meters (e.g., SPAD-502, CCM200 and Dualex 4) (Zhang et al., 2009; Ali et al., 2012b; Cerovic et al., 2015). Non-destructive techniques also include leaf reflectance measurements. In the visible and near-infrared wavelength domain the reflectance properties are mainly governed by the amount of biomass per unit area and the leaf chlorophyll content (Buscaglia, Varco, 2002; Gitelson et al., 2003).
The nitrogen content in the leaves can also be determined by analysing the distribution of colour components of the image of a single leaf or group of plants (Kawashima, Nakatan, 1998; Mercado-Luna etal., 2010; Rorie et al., 2011; Yuzhu et al., 2011; Wang et al., 2014). The aim of the study was to evaluate whether the concentration of nitrogen in apple trees leaves could be reliably estimated with an image analysis method using a flatbed scanner.
A multiple regression analysis taking into account the age of the leaf was used to develop a model for accurate estimation of the nitrogen content in the leaves of apple trees throughout the growing period. The age of the leaf was expressed as the number of days counted from the moment of its full development. Introduction of this parameter into the model clearly raised the level of data correlation. For example, the determination coefficient (for the results for the whole growing season) between the measurements of the SPAD index and the nitrogen content in the leaves was R2=0.55 (r = 0.74). In contrast, when the leaf age parameter was added to the model, its value raised the coefficient to R2 = 0.77. The highest level of correlation with the nitrogen content in the leaves was obtained with the model that took into account not only the age of the leaves but also the values of the red and blue colours (R2 = 0.91). When the leaf age parameter was omitted, the highest correlation was observed for the multiple regression model that included all three colour components R, G and B (R2 = 0.84). The high correlation values obtained by this approach mean that the nitrogen content in the leaves can be reliably determined on the basis of image analysis even when their age is unknown.
4.Optical crop sensor for variable-rate nitrogen fertilization in corn: i – plant nutrition and dry matter production[5]
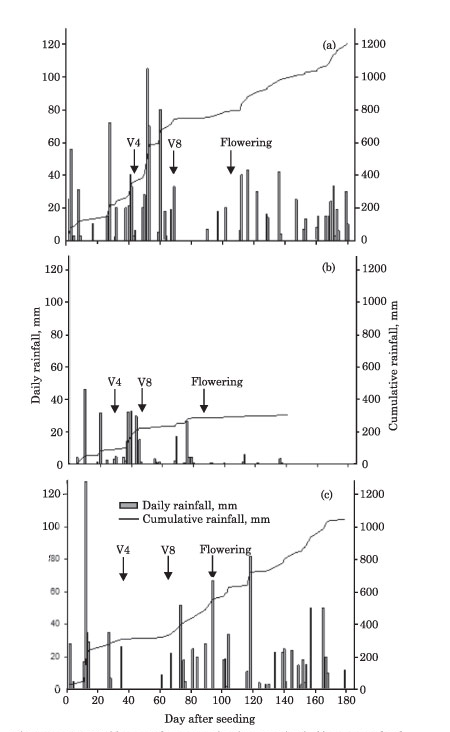
Variable-rate nitrogen fertilization (VRF) based on optical spectrometry sensors of crops is a technological innovation capable of improving the nutrient use efficiency (NUE) and mitigate environmental impacts. However, studies addressing fertilization based on crop sensors are still scarce in Brazilian agriculture. This study aims to evaluate the efficiency of an optical crop sensor to assess the nutritional status of corn and compare VRF with the standard strategy of traditional single-rate N fertilization (TSF) used by farmers.
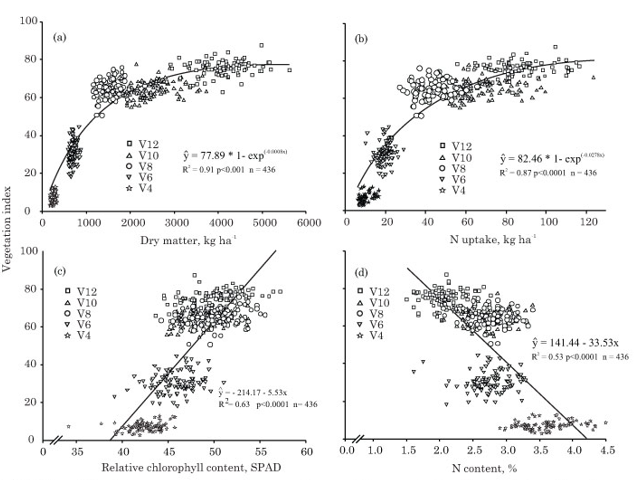
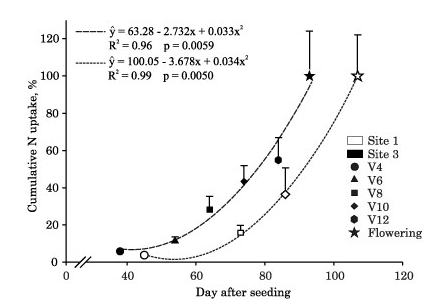
With this purpose, three experiments were conducted at different locations in Southern Brazil, in the growing seasons 2008/09 and 2010/11. The following crop properties were evaluated: above-ground dry matter production, nitrogen (N) content, N uptake, relative chlorophyll content (SPAD) reading, and a vegetation index measured by the optical sensor N-Sensor® ALS. The plants were evaluated in the stages V4, V6, V8, V10, V12 and at corn flowering. The experiments had a completely randomized design at three different sites that were analyzed separately. The vegetation index was directly related to above-ground dry matter production (R2 = 0.91; p<0.0001), total N uptake (R2 = 0.87; p<0.0001) and SPAD reading (R2 = 0.63; p<0.0001) and inversely related to plant N content (R2 = 0.53; p<0.0001).
The efficiency of VRF for plant nutrition was influenced by the specific climatic conditions of each site. Therefore, the efficiency of the VRF strategy was similar to that of the standard farmer fertilizer strategy at sites 1 and 2. However, at site 3 where the climatic conditions were favorable for corn growth, the use of optical sensors to determine VRF resulted in a 12 % increase in N plant uptake in relation to the standard fertilization, indicating the potential of this technology to improve NUE.
5.Predicting Sugarcane Response to Nitrogen Using a Canopy Reflectance-Based Response Index Value[6]
In Louisiana, sugarcane (Saccharum officinarum L.) N rate recommendations are established based on N response trials and further refined for specific crop age and soil type. Without accounting for current growing conditions and soil N levels, these recommendations can potentially lead to under- or over-application of N fertilizers. The objective of this study was to determine if N response index at harvest (RIHarvest) can be predicted using normalized difference vegetative index (NDVI) response index value (RINDVI).
Sensor and yield data were collected from different N field trials from 2008 to 2010 in St. Gabriel and Jeanerette, LA. Nitrogen fertilization treatments ranged between 0 to 201 kg N ha−1. A GreenSeeker Hand Held Optical Active Sensor[7](Trimble Navigation, Ltd., Sunnyvale, CA) was used to obtain NDVI readings for each of three consecutive weeks beginning 3 wk after fertilization. There was a strong relationship between RINDVI and RIHarvest using the traditional method of determining RI, comparing plots that received high N rates to check plots, with coefficient of determination (r2) values of 0.92 for cane tonnage and 0.81 for sugar yield (P < 0.05).
When using a modified RI value, which compared all N rates to the check plot, relationships between RINDVI and RIHarvest were comparable, with r2 values of 0.85 and 0.81 for cane tonnage and sugar yields, respectively (P < 0.05). Our results suggest that NDVI collected 4 wk after N fertilization can be used to predict sugarcane yield response to fertilizer N using the relationships established by either the traditional or modified RI methods.
Related Smart Farming Products
1.Yara N-Sensor[8]
Yara provides not only crop nutrition, but also solutions and tools for modern farming.
These allow the farmer to increase yields, while securing sustainability and reducing the carbon footprint. Sustainable agriculture requires the best farming practices possible to be applied.
Yara’s aim is to increase productivity and maximize farm profitability, while minimizing environmental harm. Modern agriculture is based on scientific knowledge, but farmers also need improved management practices.
Yara combines the best from both worlds by offering digital solutions that allow resources to be used more efficiently, while maintaining or increasing yields and decreasing harm to the environment.
Yara’s mantra in fertilizer application is to add the specific nutrients needed for the crop, in exactly the right amount, at the right time. A key concern is that too much nutrient – more than the plants can take up – is wasting money and harming nature.

Yara offers comprehensive knowledge to farmers, which is tailored to local growing conditions and specific crops. Crop Nutrition Concept is center stage in our knowledge platform, supported by tools for precision farming. These allow fertilizers and nutrients to be used more efficiently so that the crop yield and quality can be maximized whilst still keeping costs in check, avoiding over-fertilization, and protecting the environment. One of YARA’s precision farming tool is N-Sensor.
The N-Sensor is a tractor-mounted tool that allows growers to measure a crop’s nitrogen requirement as it passes across the field, and to vary the fertilizer application rate accordingly. It ensures that the optimal rate of fertilizer is applied at each individual part of the field.
Learn more about, watching the following video:
Yara also offers a range of programs and tools for smart devices, such as smartphone apps, to assist fertilizer management and maximize crop performance. The tools give farmers a means of fine-tuning application rates according to local conditions, allowing for more effective use of crop nutrients, as well as lower costs and minimum adverse effects on the environment. YARA’s app solutions include:
- DiscoverIT is a smartphone app that lets the user quickly find information about, and advice on, Yara fertilzers and crop programmes.
- ImageIT is an app that determines the nitrogen status of a crop from images taken with a standard smartphone.
- CheckIT is a smartphone app using a library of crop photographs to give a simple and fast identification of nutrient deficiencies.
- TankmixIT is a smartphone app used to check for the physical compatibility when tank mixing Yara crop nutrition products with plant protection products.
- Tankmix.com is an online service providing advice on the physical mixing characteristics of Yara’s foliar products with agrochemicals. The YaraVita foliar products are rarely sprayed alone, and therefore our unique tank mix service provides users with valuable information.
2.Cropwin[9]
Cropwin® offers the best in-season tactics for real-time irrigation and fertilization of your plots at the same time. On-season forecast.
With Cropwin® :
- Identify stressed plots on the map
- Observe the fill level of the useful reserve for the next 6 days
- Observe the satisfaction level of the nitrogen requirement by the soil for the plant over the next 6 days
- Anticipate the interventions with the season view
- Target field observations
- Identify the priority action: nitrogen or water
- Control both stresses simultaneously
- Simulate scenarios to maximize the gain
- Master your technical itinerary.

You can also anticipate stress and your interventions, manage both irrigation and nitrogen fertilization of your plots
and estimate the gain in efficiency and profitability of your interventions.
References
[1] saskatchewan.ca/business/agriculture-natural-resources-and-industry/agribusiness-farmers-and-ranchers/crops-and-irrigation/soils-fertility-and-nutrients/nitrogen-fertilization-in-crop-production
[2] Marcelo J. da Silva, Paulo S.G. Magalhães (2017), A liquid injection dosing system for site-specific fertiliser management. Biosystems Engineering, Volume 163, Pages 150-158, ISSN 1537-5110.
[3] Anserd Foster, Sam Atwell, David Dunn (2017), Sensor-based Crop Management Nitrogen Fertilization for Midseason Rice Production in Southeast Missouri, Crop Management.
[4] W. Treder, K. Klamkowski, W. Kowalczyk, D. Sas, K. Wojciκ (2016), Possibilities of using image analysis to estimate the nitrogen nutrition status of apple trees, Zemdirbyste-Agriculture, vol. 103, No. 3, p. 319–326.
[5] J. Bragagnolo; T. J. C. Amado; R. d. S. Nicoloso; J. Jasper; J. Kunz.; T. d. G. Teixeir (2013), Optical crop sensor for variable-rate nitrogen fertilization in corn: i – plant nutrition and dry matter production, Scielο.
[6] Lofton, J., B. S. Tubana, Y. Kanke, J. Teboh, and H. Viator (2012), Predicting Sugarcane Response to Nitrogen Using a Canopy Reflectance-Based Response Index Value, Agron. J. 104:106-113.
[7] slideplayer.com/slide/6229151
[8] yara.com/crop-nutrition/products-and-solutions/precision-farming