Yield Prediction [Professional]
Introduction
Crop yield determination is a crucial function in planning for food security of the population of a district or even of the whole country. Typical yield predictions are performed using knowledge of historical data on previous yields and weather patterns along with measurements manually taken in the field. These types of traditional methods are costly, time-consuming and difficult to apply in large areas[1]. The rise of agricultural drones along with the easily accessible high resolution satellite imagery has enabled an alternative nondestructive technological approach that allows for high accuracy crop yield estimations based on data from the fields. Remote sensing can provide quick coverage over a field at any scale and estimate crop yield in a cost-effective manner. Remote sensing data collected at critical growth stages can help agricultural engineers and producers to improve their models, predictions and planning, ultimately leading to better planning of harvesting and increase in both quality and final yield.[2]
Related Smart Farming Technology Products
Farmers Edge[3]
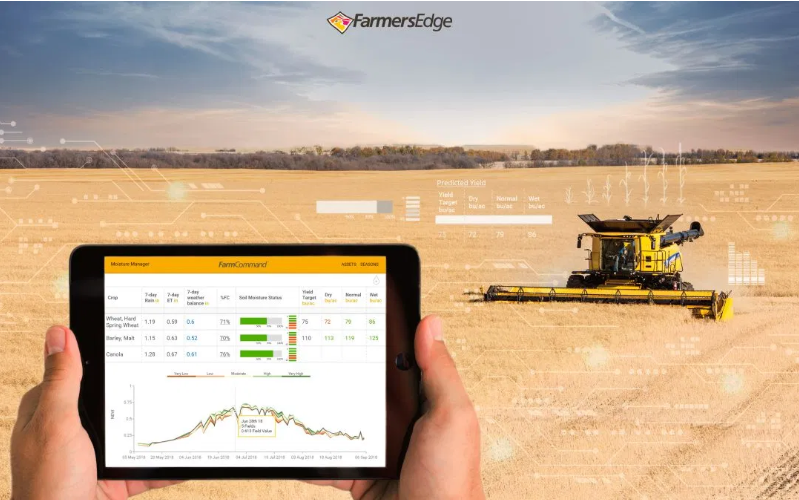
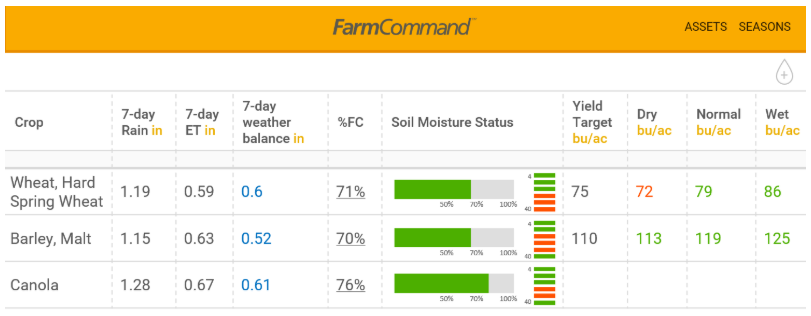
Farmers Edge uses multiple datasets to predict yields in five main crops: canola, corn, lentils, soybeans, and wheat. These datasets involve machine learning, agronomic data, crop plans, and field-centric information that impact yield throughout a season.
Bitrefine Group Yield Estimation[4]
BitRefine group works on a number of approaches that depend on available input data, such as Geospatial images and Weather data. A machine-learning model based on historical data is built and trained, which then includes observed attributes, allowing the model to calculate relative yield indicators. Then, with precise sampling data added, the model is able to accurately predict yield according to the sample data collection. Finally, the model combines relative yield indicators across a whole field or a number of fields together with precise calculation from sampling points and provides the farmer with accurate numbers across all areas of interest. to calculate relative yield indicators.
Related Scientific Papers and Projects
Evaluation of different sensing approaches concerning to nondestructive estimation of leaf area index (LAI) for winter wheat[1]
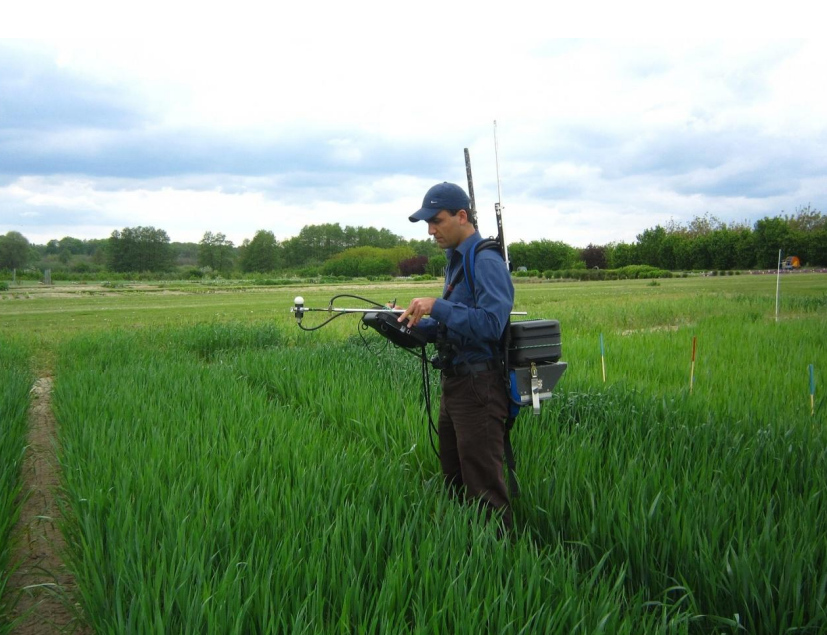
Vegetation Indices such as NDVI have a strong correlation with final yield, with several studies demonstrating that NDVI can provide information about crop vegetative status, biomass and yield characteristics. In this paper different approaches of non-destructive estimation of the LAI in winter wheat were compared, including digital camera imagery and spectral reflectance sensors.
Stars Project[5]
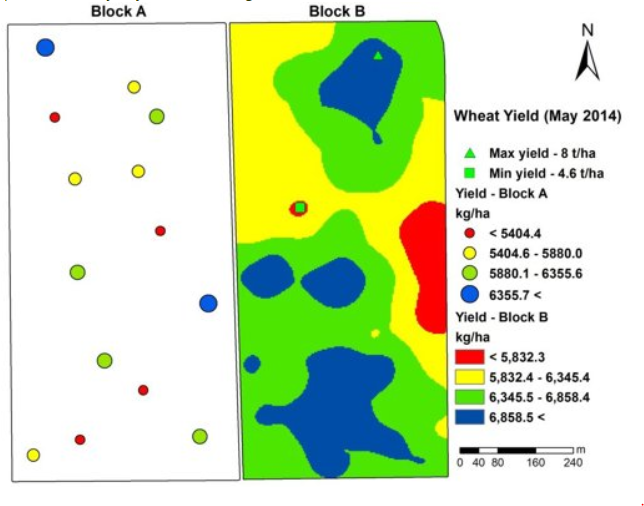
Within the STARS project, high resolution soil surveys coupled with hyperspectral remote sensing data were combined to estimate the spatial variability of grain yield prior to harvest period. In the following figure, a map of the within-field spatial variability of yield is presented, with a range from 4.6 to 8 t/ha.
Machine learning methods for crop yield prediction and climate change impact assessment in agriculture[6]
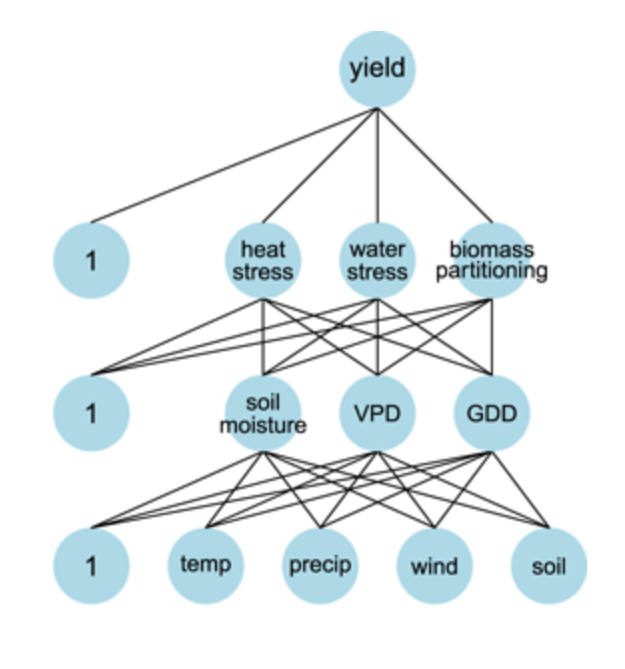
This paper focuses on the latter—yield prediction from weather. Accurate models mapping weather to crop yields are important not only for projecting impacts to agriculture, but also for projecting the impact of climate change. The authors describe an approach to yield modeling that uses a semiparametric variant of a deep neural network, which can simultaneously account for complex nonlinear relationships in high-dimensional datasets,
Combining Remote Sensing Data And Machine Learning To Predict Crop Yield[7]
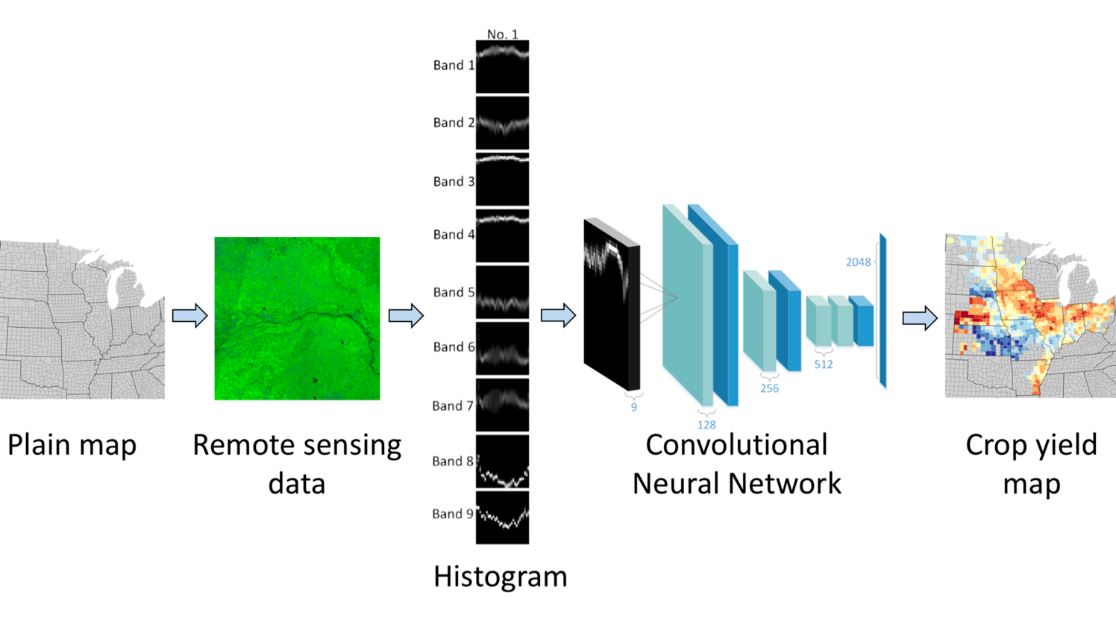
In the project, a scalable, accurate, and inexpensive method to predict crop yield using publicly available remote sensing data and machine learning was introduced. This deep learning approach can predict crop yield with high spatial resolution (county-level) several months before harvest, using only globally available covariates.
Active-Optical Sensors Using Red NDVI Compared to Red Edge NDVI for Prediction of Corn Grain Yield in North Dakota, U.S.A[8]
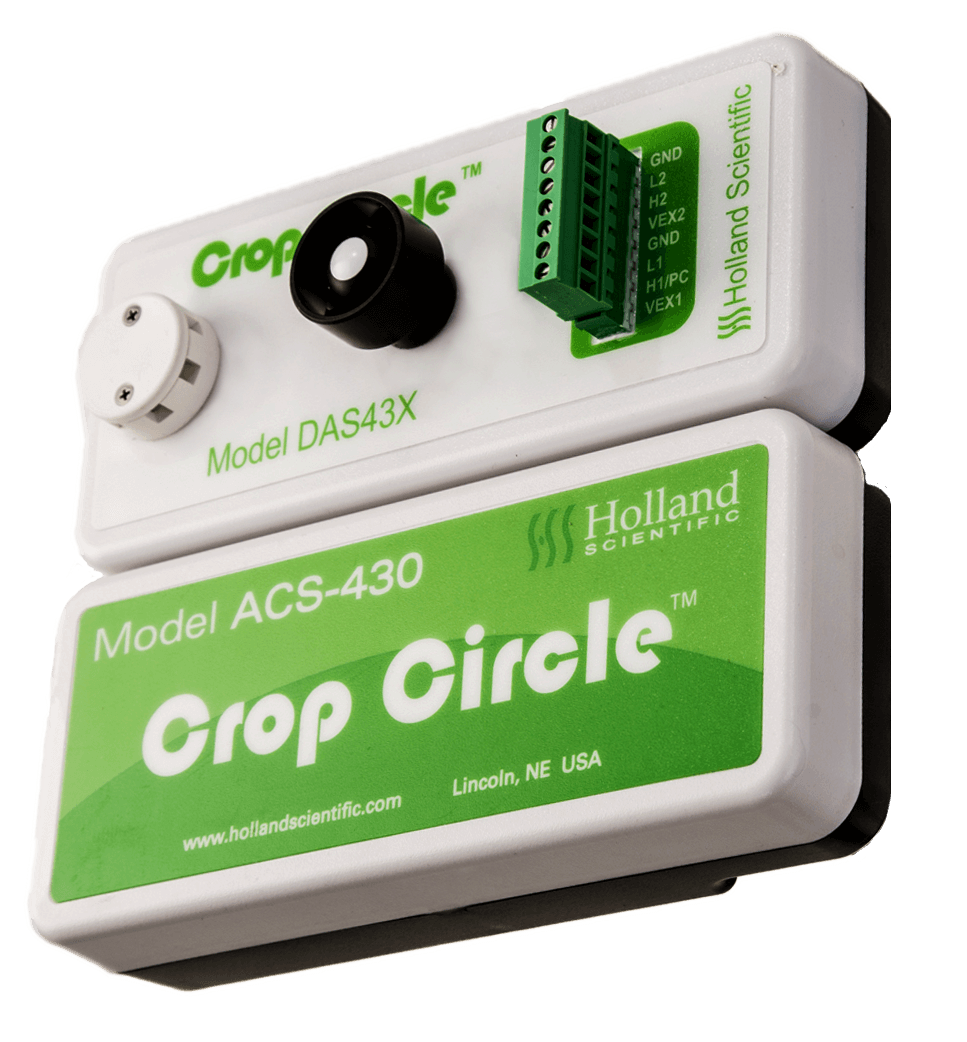
Use of red edge NDVI might improve corn yield prediction at later growth stages when corn leaves cover the inter-row space resulting in “saturation” of red NDVI readings. The purpose of this study was to determine whether the use of red edge NDVI in two active-optical sensors (GreenSeeker™ and Holland Scientific Crop Circle™) improved corn yield prediction. Nitrogen rate experiments were established at 15 sites in USA.
References
[1] Mieke Reyniers, Els Vrindts, Josse De Baerdemaeker, Josse De Baerdemaeker (2006) Comparison of an aerial-based system and an on the ground continuous measuring device to predict yield of winter wheat. European Journal of Agronomy 24(2):87-94
[2] SenseFly
[3] FarmersEdge
[4] Bitrefine Group
[5] Stars project – Yield estimation
[6] Andrew Crane-Droesch (2018) Machine learning methods for crop yield prediction and climate change impact assessment in agriculture. Environmental Research Letters, Volume 13, Number 11
[7] Jiaxuan You, Xiaocheng Li, Melvin Low, David B. Lobell, Stefano Ermon. Combining Remote Sensing Data And Machine Learning To Predict Crop Yield. Sustainability And Artificial Intelligence Lab Stanford University
[8] Lakesh K. Sharma, Honggang Bu, Anne Denton, and David W. Franzen (2015) Active-Optical Sensors Using Red NDVI Compared to Red Edge NDVI for Prediction of Corn Grain Yield in North Dakota, U.S.A. Sensors (Basel). 2015 Nov; 15(11): 27832–27853.