Canory Reflectance Sensors [Professional]
Introduction
Remote Sensing is the ability to measure the properties of an object or region without the need of physical contact with the object itself (Lillesand and Keifer, 1994). In most remote sensing applications, electromagnetic radiation (EMR) is used to ‘sense’ a certain attribute of the object or area of interest.[1]
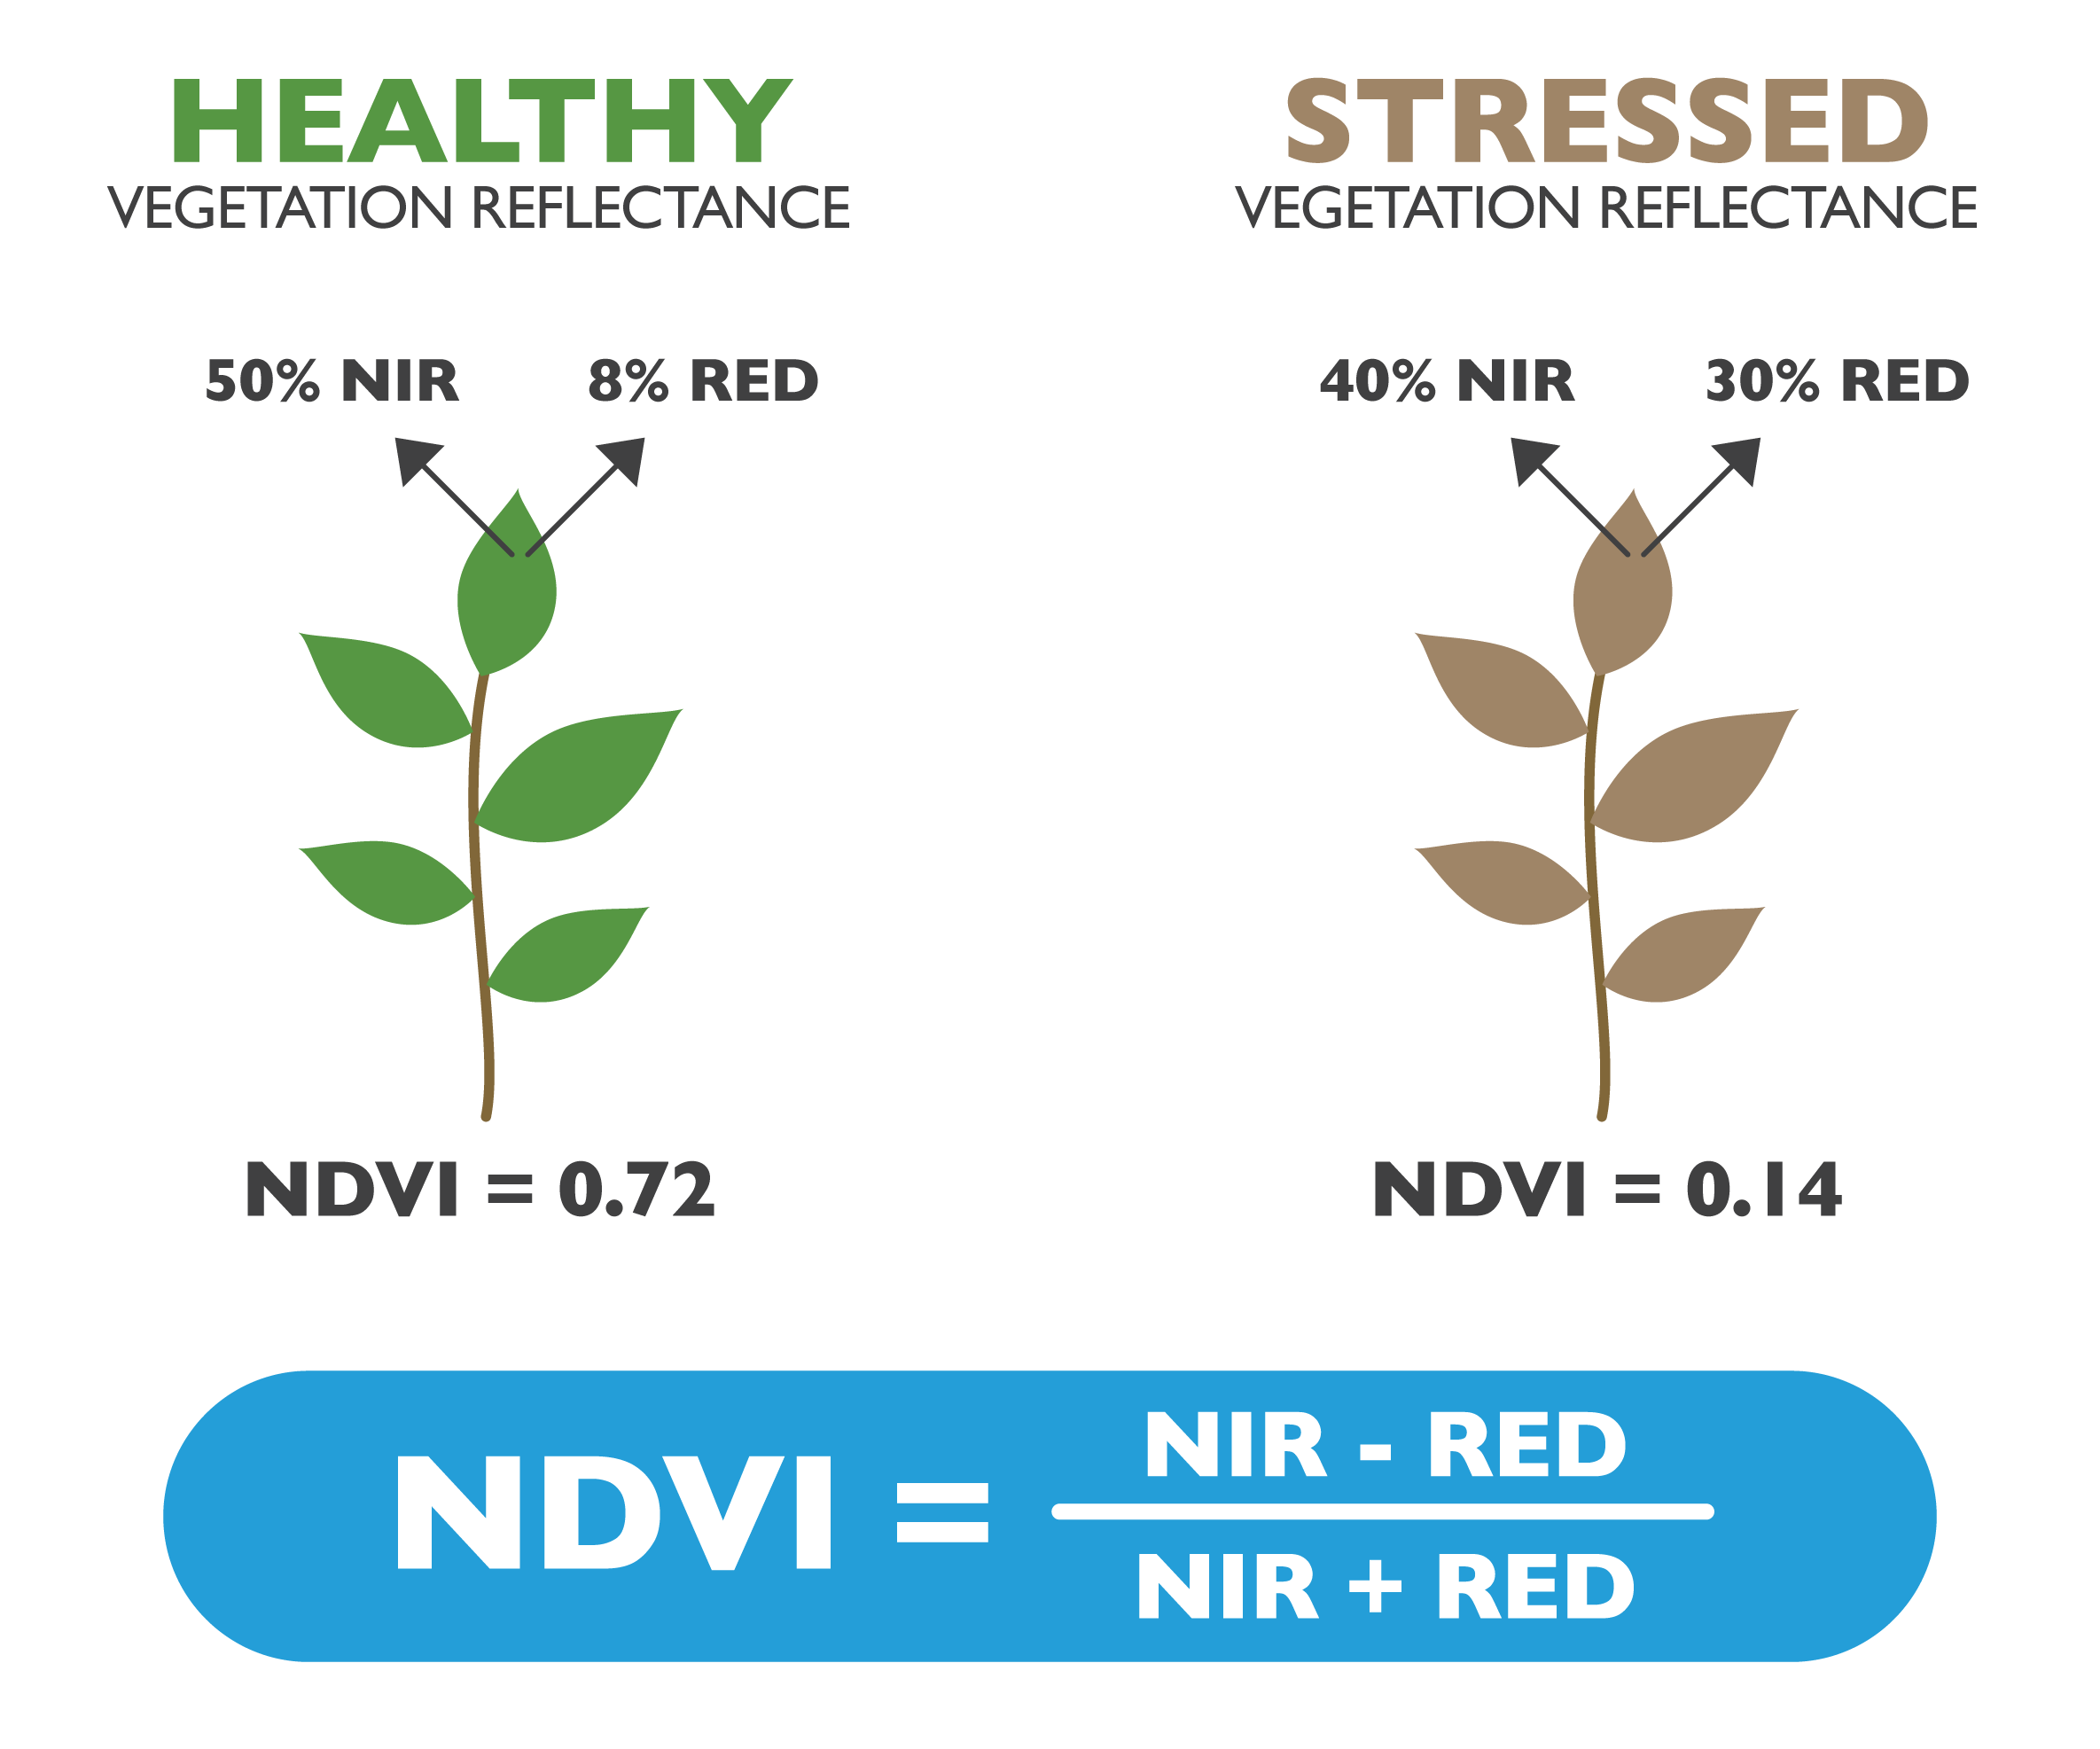
The vegetation indices are a combination of the percentage of refracted radiation in different specific bands. The Normalized Difference Vegetation Index (NDVI) is the most known and used vegetation index, which quantifies green vegetation. It normalizes green leaf scattering in the Near Infra-red wavelength and chlorophyll absorption in the red wavelength. The value range of NDVI is -1 to 1. Negative values of NDVI (values approaching -1) correspond to water. Values close to zero (-0.1 to 0.1) generally correspond to barren areas of rock, sand, or snow. Low, positive values represent shrub and grassland (approximately 0.2 to 0.4), while high values indicate temperate and tropical rainforests (values approaching 1).[3]
Related Smart Farming Technology Products
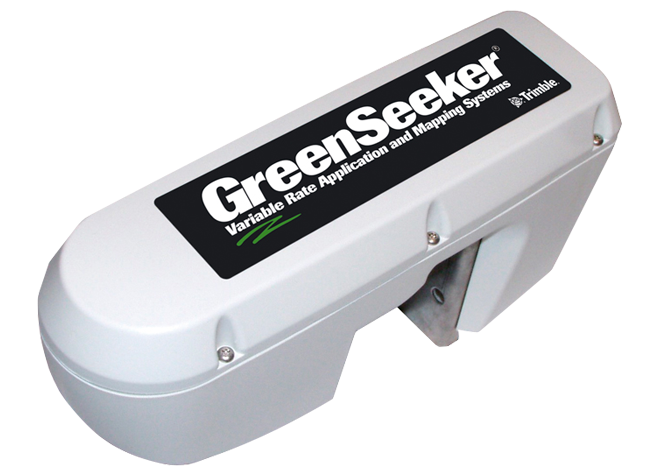
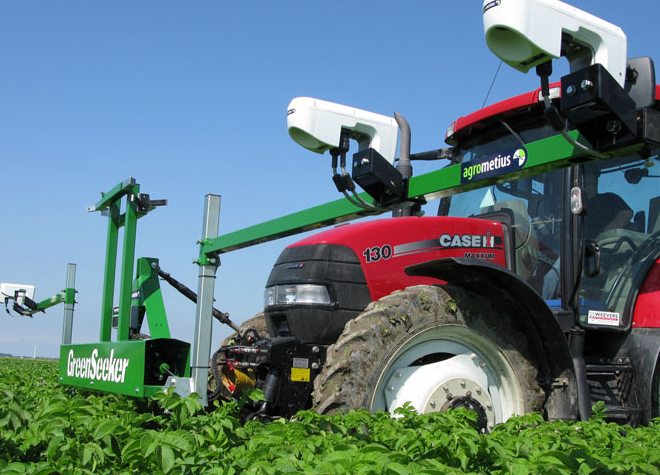
Trimble GreenSeeker[5]
The GreenSeeker system uses optical sensors to measure and quantify the variability of the crop. It then creates a targeted prescription to treat the crop variability.
TopCon CropSpec[6]
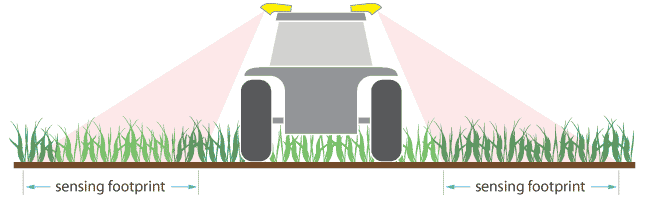
CropSpec sensors measure plant reflectance to determine chlorophyll content, which correlates to nitrogen concentration in the leaf. CropSpec units mount on the cabin roof out of harm’s way, providing the largest sensor footprint in the industry, attaining more accuracy in application.
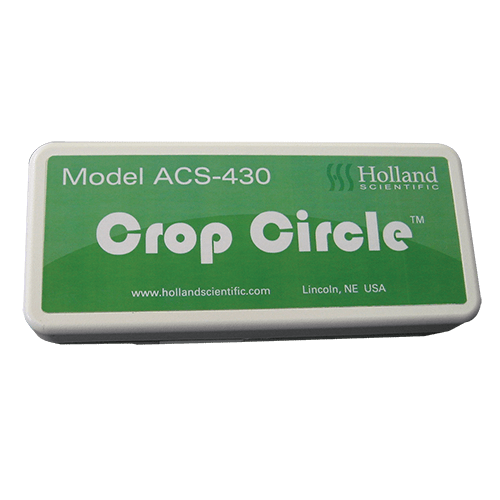
Crop Circle ACS-430[7]
The Crop Circle ACS-430 active crop canopy sensor provides classic vegetative index data as well as basic reflectance information from plant canopies and soil. Unlike passive radiometric light sensors, the Crop Circle ACS-430 is not limited by ambient lighting conditions— measurements can be made day or night due to its unique, light source technology.
For on-the-go applications, the Crop Circle ACS-430 sensor can be mounted to virtually any type of vehicle to remotely sense and/or map plant or crop canopy biomass while driving through a field.
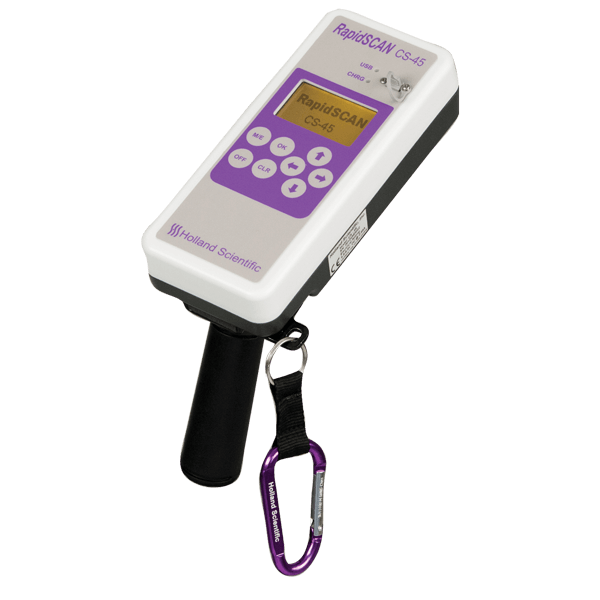
RapidSCAN CS-45 Handheld Crop Sensor[8]
The RapidSCAN CS-45 represents the latest advancement in active crop canopy sensing solutions. The RapidSCAN CS-45 is a completely self-contained active crop canopy sensor that integrates a data logger, graphical display, GPS, crop sensor and power source into one, small compact instrument.
The sensor is unaffected by ambient illumination allowing it to take accurate biomass measurements day or night due to its internal polychromatic light source. The sensor is capable of collecting data from vegetation at sensor-to-canopy distances ranging from 0.3 meters to over 3 meters.
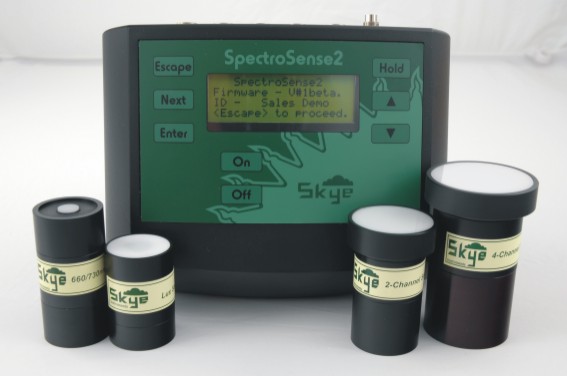
Skye Instruments SpectroSense 2[9]
SpectroSense 2 is a reflectance sensor that uses its own sensors to make corrections os its data reading with sunlight sensors mounted near the canopy sensors, taking into consideration both reflected and incident sunlight for each data sampling.
References
[1] Lillesand, T. M. and R. W. Kiefer. 1994. Remote Sensing and Photo Interpretation, third edition. John Wiley and Sons, Inc., New York, NY, USA.
[2] A. S. Chauhan, R. Sharma, A. Kumar, et al. (2018) Applications Of Remote Sensing In Agriculture. Agricultural, Allied Sciences & Biotechnology for Sustainability of Agriculture, Nutrition & Food Security. Mahima Publications 194, Karaundi, Banaras Hindu University, Varanasi-221 005, UP, India
[3] Sentinel-hub
[4] Agricolus.com
[5] Trimble Greenseeker System
[6] Topcon Cropspec